Feeling stuck in a loop of unresolved problems? You’re not alone—many analytical thinkers spend hours circling the same issues without a clear path forward.
What if you could treat your life like a debuggable system? This PDES niche case study shows how a structured, 30‑minute session can uncover your top three problems, isolate their root causes, and produce a ready‑to‑execute fix plan.
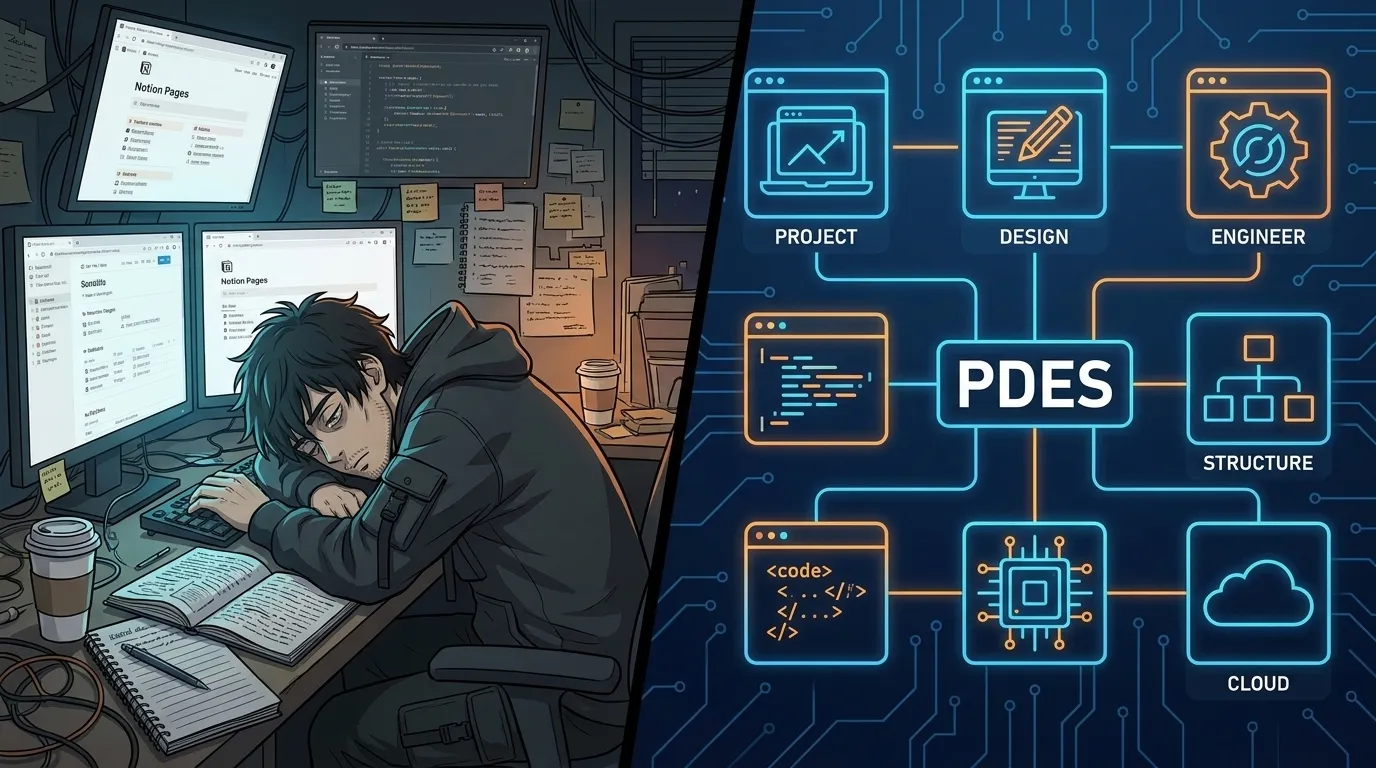
The PDES Framework: Perceive Model, Design Build, Measure Optimize
PDES (Personal Development Engineering System) applies computer‑science logic to personal growth. The six‑phase engine works like a software lifecycle:
- Perceive – Gather raw data about your current state (emotions, tasks, blockers).
- Model – Translate that data into a clear system map (variables, loops, dependencies).
- Design – Draft actionable protocols and decision trees.
- Build – Create SOPs, trackers, and micro‑habits.
- Measure – Apply Life Quant metrics to see what’s working.
- Optimize – Debug, refactor, and automate the habit loop.
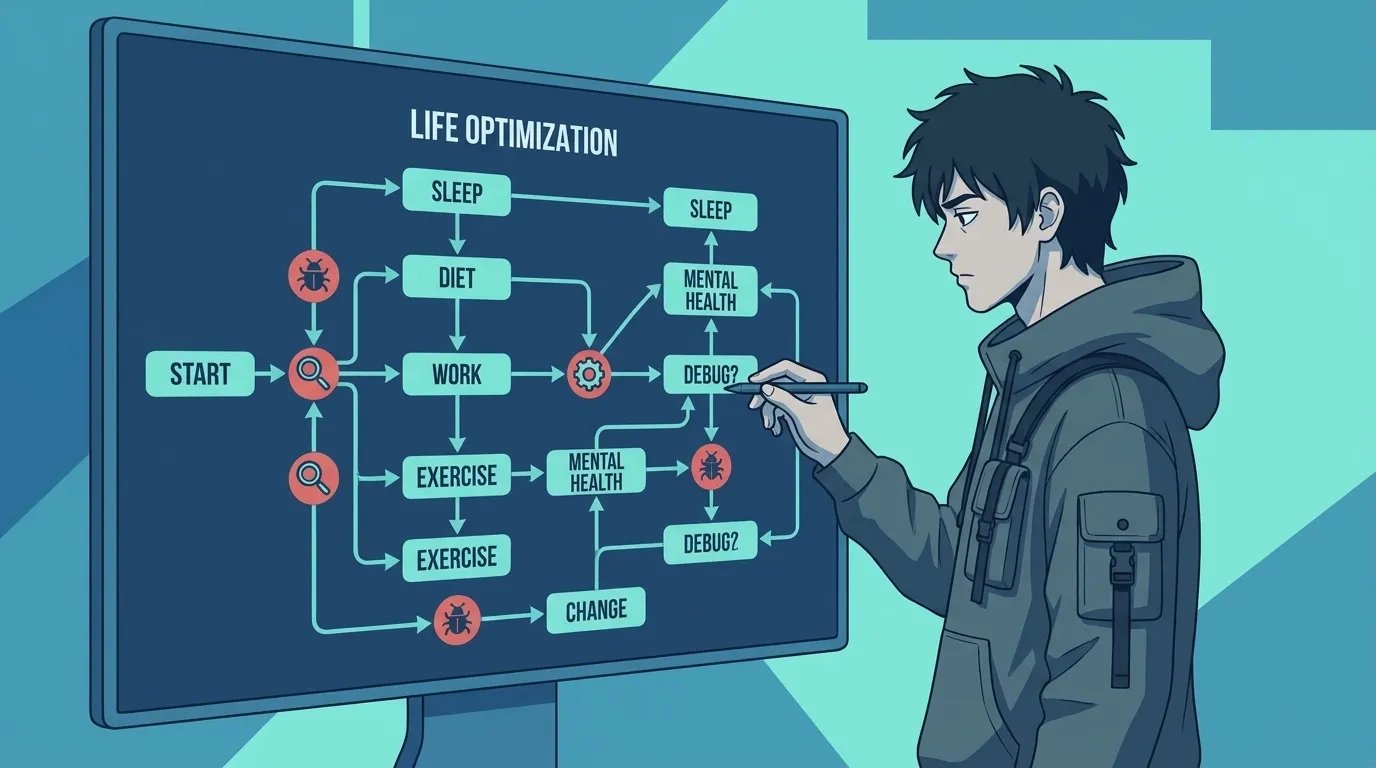
Applying the Niche Case Study: From Chaos to Clarity in 30 Minutes
Here’s how the framework was applied in a real‑world session with an analytical thinker feeling overwhelmed by work, health, and side‑projects.
- Perceive (5 min) – Quick brain dump: list every open issue, rate each on impact (1‑5) and urgency (1‑5).
- Model (5 min) – Draw a simple cause‑effect diagram: identify which problems are symptoms and which are root nodes.
- Design (5 min) – For each root node, write a ONE‑sentence “fix statement” and decide the smallest testable experiment.
- Build (5 min) – Turn the fix statement into a micro‑SOP: trigger → action → verification (e.g., “After lunch, review inbox for 10 min → flag → move to ‘Today’ folder”).
- Measure (5 min) – Pick one Life Quant metric (e.g., Expectancy) and set a baseline and target for the next week.
- Optimize (5 min) – Schedule a 5‑minute review tomorrow to see if the SOP ran; adjust if needed.
Life Quant Metrics: Measuring Your Debugging Progress
To know whether your debug session moved the needle, you need a quantitative feedback loop. One powerful metric is Expectancy:
Expectancy = (Win Rate × Avg Win) – [(1 – Win Rate) × Avg Loss]
In the case study, the participant estimated a 30 % win rate for completing micro‑SOPs, with an average win of 2 units of productivity and an average loss of 1 unit when a SOP failed. Plugging those numbers in:
Expectancy = (0.30 × 2) – [(1 – 0.30) × 1] = 0.60 – 0.70 = –0.10
A negative expectancy signaled that the current approach was losing more than gaining. After refining the SOP (making the trigger clearer and reducing friction), the win rate rose to 55 %:
Expectancy = (0.55 × 2) – [(1 – 0.55) × 1] = 1.10 – 0.45 = 0.65
The shift from –0.10 to +0.65 expectancy gave a clear, numerical sign that the debug plan was working.
Results: What Analytical Thinkers Gained
After the 30‑minute PDES niche case study, the participant reported:
- Clear identification of the top three problems (task overload, unclear health routine, side‑project stagnation).
- A one‑page root‑cause map showing how each problem fed into the others.
- Three ready‑to‑test micro‑SOPs, each under two minutes to start.
- Baseline Life Quant metrics and a simple tracking sheet for weekly review.
- A 15‑minute daily “debug checkpoint” habit to keep the system running.
How It All Connects: Turning Insight into Action
The power of this PDES niche case study lies in the tight loop:
- Perceive gives you honest data—no more guessing.
- Model turns that data into a visual system you can manipulate.
- Design creates low‑friction experiments.
- Build turns experiments into repeatable SOPs.
- Measure supplies the feedback (Life Quant) that tells you if you’re improving.
- Optimize closes the loop, letting you iterate faster than before.
When you run this loop once, you get a snapshot. When you run it daily, you get a self‑optimizing life.
Ready to debug your own life in just half an hour?